
In brief
- Bitcoin traders today were spooked by the mother of all mysterious Bitcoin whales.
- The price of Bitcoin fell from above $109K to near $107K.
- But the macro picture and technical indicators suggest the Bitcoin bull run is far from over, despite short-term price action.
War, geopolitical uncertainty, President Donald Trump’s “Big Beautiful Bill”—with so much going on, what could possibly be shaking the Bitcoin market today? How about one of the biggest Bitcoin holders in history suddenly moving $8 billion from their wallet? Yikes.
The crypto community was shaken today by the movement of 80,000 BTC—worth approximately $8.6 billion at today’s prices—from wallets that had remained dormant for over 14 years. This “OG” holder, who controls the funds across eight wallets, received their coins in April and May 2011—way back when Bitcoin traded between $0.78 and $3.37. Talk about diamond hands.
The entity—whoever it, he, she, they are—had accumulated up to 200,000 BTC at one point in 2011, representing what would be $22 billion today. That puts this whale in the top five Bitcoin holders of all time, according to Coinbase Director Conor Grogan. The Coinbase exec initially speculated that the wallets could belong to an unmarked crypto exchange, then said it was more likely a very early Bitcoin miner, before landing on it possibly being the result of a hack. Oh boy.
The timing of the move, on a U.S. holiday weekend when “everyone is at the beach,” has also raised eyebrows and stirred speculation across Crypto Twitter about potential market manipulation.
Needless to say, skittish Bitcoin traders didn’t like this one bit, as the price of Bitcoin fell from above $109,000 to around $107,500 following news of the OG whale’s moves. This won’t be welcomed news to the 40% of users over on Myriad, a prediction market developed by Decrypt’s parent company Dastan, who predicted the price of Bitcoin would stay above $108,000 by the end of the week. But to the 59% of bears who said Bitcoin would dip, congrats.
So where could Bitcoin go from here in the long-term? Let’s take a look at the charts.
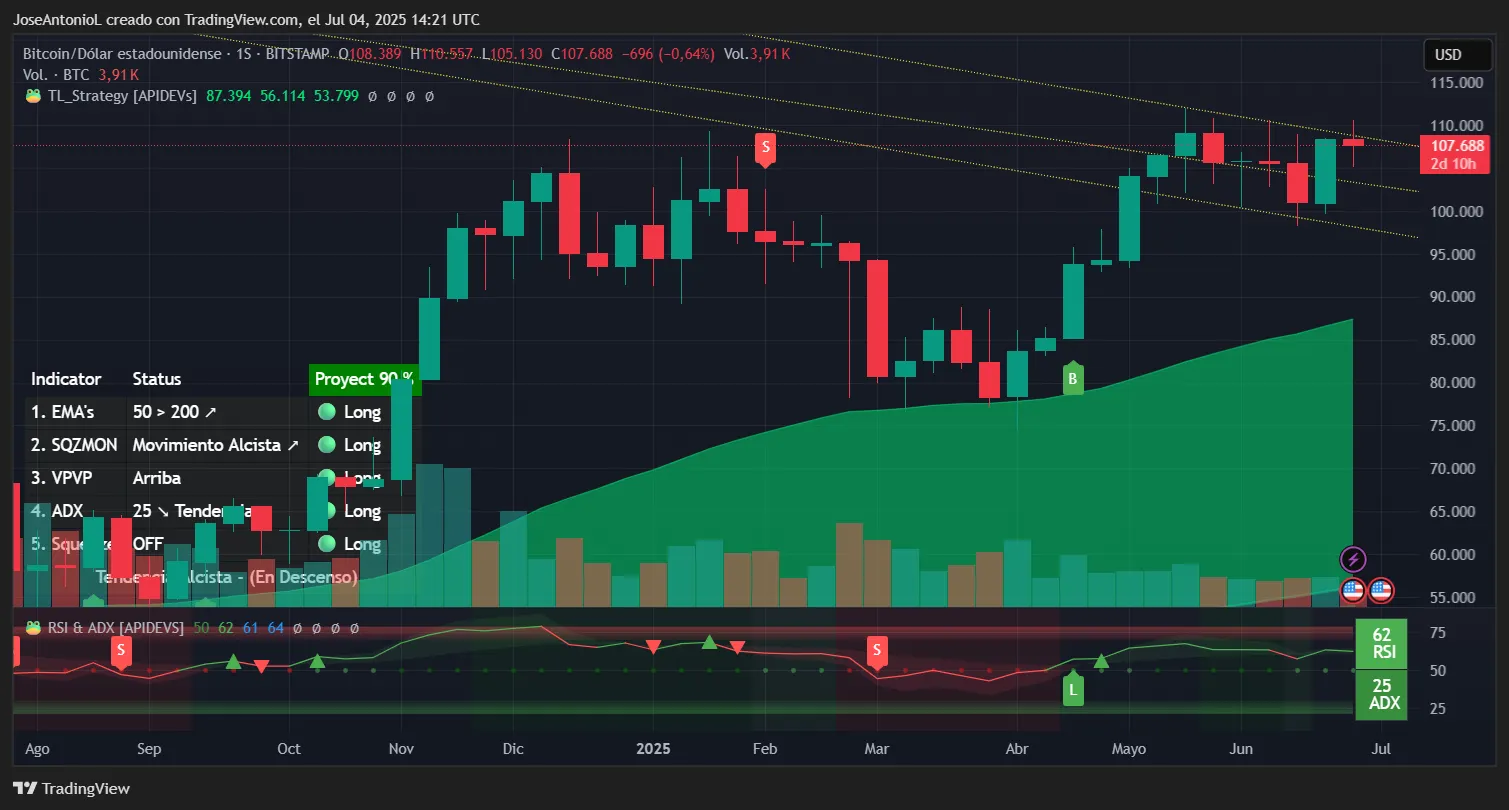
Short-term traders appear to be taking profits after Bitcoin’s 15% rally over the past 60 days, creating a “sell the news” dynamic. The cryptocurrency faces immediate technical resistance at the $110,561 swing high from June 27, unable to break past the resistance of a short bearish channel that has been in play for seven weeks already.
The Average Directional Index, or ADX, which measures how strong or weak a price trend is, reads 25—sitting exactly at the threshold that typically separates choppy, directionless markets from trending ones. Think of ADX as a trend strength meter: below 25 means weak or no trend, above 25 indicates a trend is developing, and above 40 signals a very strong trend.
The Exponential Moving Averages, or EMAs, also tell a bullish story despite recent weakness. EMAs usually behave like dynamic support and resistance levels that give more weight to recent prices. The 50-period EMA (the faster-moving average, measuring the average price of the last 50 weeks) sits at $87,394, while the 200-period EMA (the slower, more significant one) is way down at $56,114. When price trades above both EMAs and they’re rising, it confirms an uptrend. Bitcoin remains well above both, maintaining its long-term bullish structure.
The Relative Strength Index, or RSI, currently reads 62. RSI measures momentum by comparing recent gains to recent losses on a scale of 0-100. Readings above 70 suggest the asset might be moving up too fast (overbought), while below 30 indicates it might be oversold. At 62, Bitcoin shows moderate upward momentum with room to run higher before becoming overheated.
The Squeeze Momentum Indicator shows there is still a solid bullish trend in play. This indicator identifies when volatility is expanding after being compressed—like a spring being released. When the squeeze is “off,” it means volatility is increasing, and the green signal suggests the likely direction is upward.
In other words, indicators show that, for now, position traders and hodlers are still bullish, despite the current bearish mood among short-term traders.
Key Bitcoin Levels to Watch:
Resistance: $110,000 (recent rejection point), $115,000 (psychological level)
Support: $105,000 (immediate), $100,000 (major psychological), $87,394 (50-week EMA)
Disclaimer
The views and opinions expressed by the author are for informational purposes only and do not constitute financial, investment, or other advice.
Daily Debrief Newsletter
Start every day with the top news stories right now, plus original features, a podcast, videos and more.
News source: Bitcoin Dives on OG Whale FUD, But Charts Remain Bullish: Analysis
Read the full article and more directly from the source!
Enjoying our initiative? Support us with a BTC donation:
BTC Wallet: bc1q0faa2d4j9ezn29uuf7c57znsm5ueqwwfqw9gde
